Basis of LiPo Battery Specifications
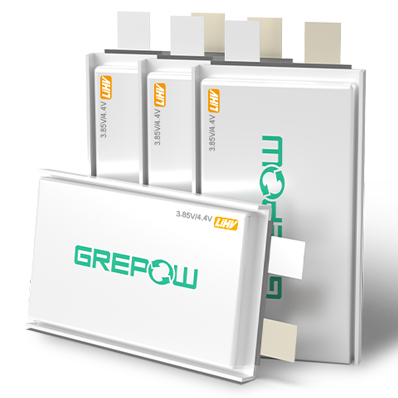
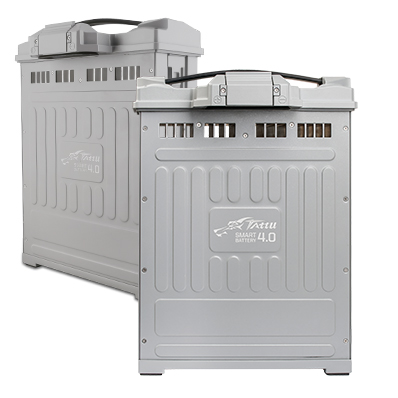
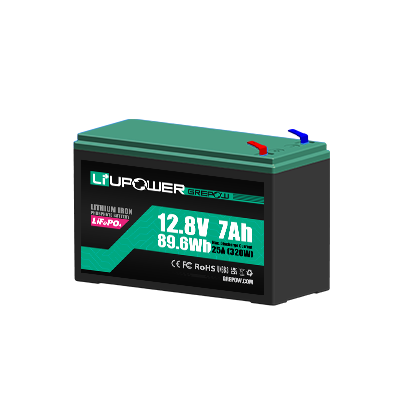
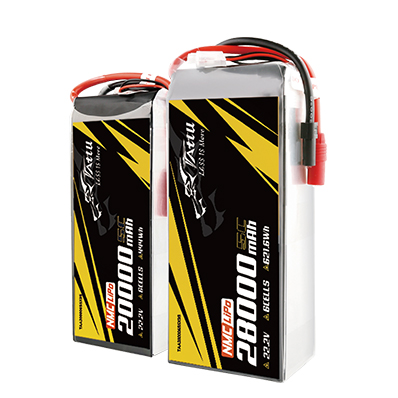
Lithium Polymer (LiPo) batteries are widely used in drones, electric vehicles, and portable electronics due to their high energy density, lightweight, and customizable shapes. Understanding the core specifications of LiPo batteries is essential for optimizing their use and ensuring safety. Below, we break down the key aspects of LiPo battery specifications.
Capacity of a LiPo Battery
The capacity of a LiPo battery, measured in milliampere-hours (mAh) or ampere-hours (Ah), indicates the total energy it can store. A higher capacity means the battery can deliver a given current for a longer time. For example, a 5000mAh battery can theoretically provide 5000mA (5A) of current for one hour.
Implications: Capacity directly impacts runtime. For drones, higher capacity can increase flight duration but may also add weight, reducing efficiency.
Voltage of a LiPo Battery
The voltage of a LiPo battery is determined by its cell count, with each cell having a specific nominal voltage. Common configurations include:
●1S: 3.7V nominal
●2S: 7.4V nominal
●3S: 11.1V nominal
Higher voltage allows the battery to deliver more power, which is crucial for high-performance applications.
What is Nominal Voltage?
The nominal voltage is the average voltage of a cell during normal discharge, typically 3.7V per cell.
What is Charge Voltage / Maximum Voltage?
The charge voltage or maximum voltage is the voltage a cell reaches at full charge, typically 4.2V per cell. Overcharging above this voltage can damage the battery or cause safety hazards.
What is Discharge Voltage / Cut-off Voltage / Minimum Voltage?
The discharge voltage, cut-off voltage, or minimum voltage is the lowest safe voltage for a cell, usually 3.0V. Discharging below this level can cause irreversible damage to the battery.
Discharge Specifications of a LiPo Battery
What is Discharge Rate?
The discharge rate of a LiPo battery, commonly expressed in terms of C-rate, represents the speed at which the battery can safely discharge its capacity. The "C" stands for the capacity of the battery. For example:
●A 1C discharge rate means the battery can discharge its entire capacity in one hour.
●A 2C discharge rate means the battery can discharge twice its capacity in one hour (in 30 minutes).
●A 0.5C discharge rate means the battery can discharge half its capacity in one hour (in two hours).
What is Max Continuous Discharge Current?
The discharge current is the rate at which a battery delivers current to a load, measured in amperes (A). The max continuous discharge current specifies the maximum current the battery can safely provide continuously without overheating or damaging cells. It is often expressed as a multiple of capacity (C-rate).
Relationship between discharge rate and max continuous discharge current
The discharge rate (C-rate) is a way to express the max continuous discharge current in relation to the battery's capacity. The two are mathematically related by the formula:
Max Continuous Discharge Current (A)=C-rate×Battery Capacity (Ah)
Example: For a 5000mAh (5Ah) battery
If the max discharge rate is 20C, the max continuous discharge current is: Max Continuous Discharge Current=20C×5Ah=100A
The max continuous discharge current is the same, but the discharge rate expresses it relative to capacity.
What is Max Pulse (≤ 30 seconds) Discharge Current?
The maximum current at which the battery can be discharged for pulses of up to 30 seconds. This limit is usually defined by the battery manufacturer in order to prevent excessive discharge rates that would damage the battery or reduce its capacity. Along with the peak power of the electric motor, this defines the acceleration performance (0-60 mph time) of the vehicle.
What is Discharge Rate Curve?
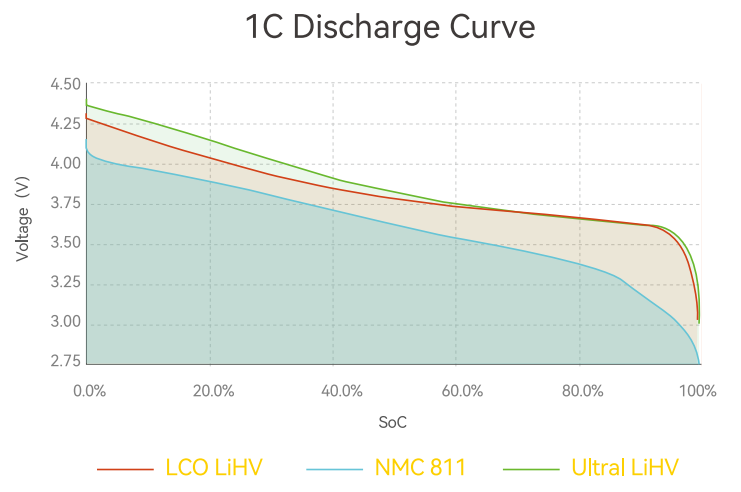
The discharge rate curve of a LiPo battery is a graphical representation of how the battery's voltage changes over time (or capacity) when discharged at different rates (C-rates). It helps evaluate how well the battery maintains its voltage under varying loads and provides insights into the battery's performance, efficiency, and suitability for specific applications.
Common Parameters of the Discharge Rate Curve
1. Voltage (V): The vertical axis typically represents the battery voltage.
2. Capacity (Ah or %) or Time (h): The horizontal axis represents either the battery capacity as a percentage (State of Charge - SOC), the absolute capacity in ampere-hours (Ah), or the time (in hours or minutes) elapsed during discharge.
3. Discharge Rates (C-rate): Curves are plotted for different C-rates (e.g., 1C, 5C, 10C, etc.).
4. Temperature (°C): Some discharge curves include data at different operating temperatures to assess thermal performance.
5. Cutoff Voltage (V): The point at which the curve ends, indicating the minimum safe voltage (usually 3.0V per cell).
How to Tell the Performance of the Battery from the Discharge Rate Curve?
Voltage Stability:
Ideal Performance: A flat curve across most of the discharge cycle, indicating stable voltage.
Poor Performance: A steep voltage drop early in the cycle or excessive sag at higher discharge rates.
Capacity Retention:
Ideal Performance: Consistent capacity across a range of discharge rates.
Poor Performance: Significant capacity reduction at higher C-rates.
Thermal Stability:
Ideal Performance: Minimal change in curve shape across a range of operating temperatures.
Poor Performance: Significant sag or capacity loss at low or high temperatures.
What is Depth of Discharge (DOD) or State of Charge (SOC)?
The DOD represents the percentage of the battery's capacity used during discharge. For instance, a DOD of 80% means 80% of the total capacity is consumed. A discharge to at least 80 % DOD is referred to as a deep discharge. Higher DOD reduces cycle life.
The SOC indicates the remaining charge in the battery as a percentage of its total capacity. It serves as an indicator of how much energy is available for use compared to the maximum energy the battery can store. For instance, 50% SOC means the battery is half-charged.
Relationship Between SOC and DOD
SOC and DOD are complementary parameters:
SOC=100%−DOD
For example:
If the SOC is 70%, the DOD is 30%.
If the SOC is 40%, the DOD is 60%.
Both are essential for understanding a battery's state, but SOC is more common for real-time monitoring, while DOD is more often used in lifecycle analysis and performance studies.
Charge Specifications of a LiPo Battery
What is Charge Current
The typical charge current is the recommended current for charging. Often expressed as a fraction of the battery's capacity, e.g., 0.5C or 1C. For a 5000mAh battery, this equals 2.5A or 5A.
Maximum Charge Current
The maximum charge current is the highest safe current for charging, typically higher than the typical charge current but may reduce cycle life if used frequently.
What is Charge Rate?
The charge rate (C-rate) is the ratio of charge current to battery capacity. A 1C charge rate means charging the battery in one hour. A higher C-rate indicates a faster charging time.
What is Charge Rate Curve?
The charge rate curve of a LiPo battery is a graphical representation of the relationship between charging current, voltage, and state of charge (SOC) over time. It provides insights into how the battery accepts charge at different stages of the charging process and helps evaluate the battery's performance, charging efficiency, and safety characteristics.
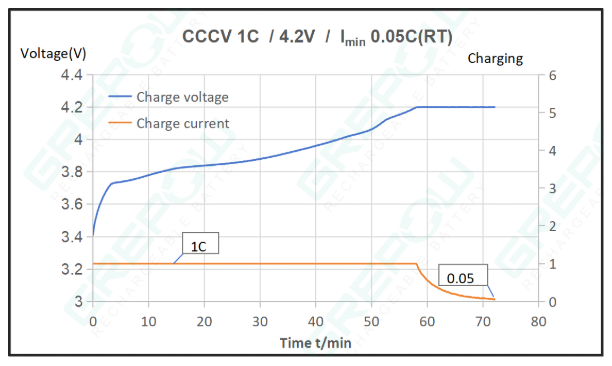
Common Parameters in a Charge Rate Curve
●Voltage (V): Represents the battery's terminal voltage during the charging process.Typically shown on the vertical axis.
●State of Charge (SOC) (%): Represents the percentage of the battery's total capacity that is charged. Usually plotted on the horizontal axis.
●Current (A): Represents the charging current supplied to the battery. Often starts high and tapers off as the battery approaches full charge.
●Time (hours): The duration of the charging process.
●Temperature (°C): Indicates the thermal response during charging, especially at high currents.
A typical Lipo battery charging curve consists of two phases:
●Constant Current (CC) Phase: Current remains constant while the voltage gradually rises.
●Constant Voltage (CV) Phase: Voltage is held constant while the current gradually decreases until the battery reaches full charge.
How Can We Tell the Performance of the Battery from the Charge Rate Curve?
●Charging Efficiency: A well-performing battery should charge quickly and efficiently, with minimal energy loss. The shape of the curve can indicate the charging efficiency.
●Charging Time: The time taken to reach full charge can be determined from the curve. A shorter charging time indicates better charging performance.
●Temperature Rise: The battery's temperature during charging should be monitored. Excessive temperature rise can lead to reduced battery life and potential safety hazards.
●Capacity Retention: The battery's ability to retain its capacity over multiple charge-discharge cycles can be assessed by analyzing the charging curves.
Cycle Life of a LiPo Battery
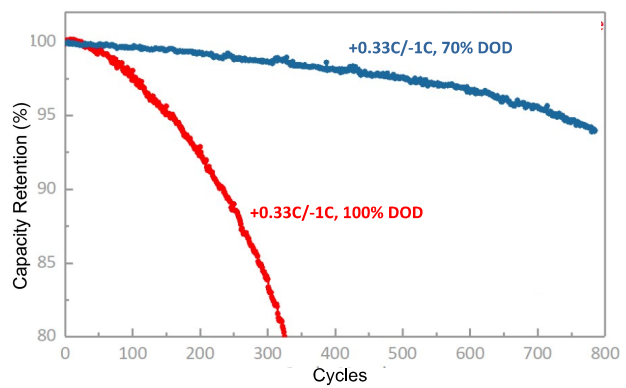
The cycle life is the number of charge-discharge cycles a battery can undergo before its capacity drops to 80% of its original value. Factors like DOD and temperature significantly affect cycle life.
Cycle Life Curve (Number for a Specific DOD)
The cycle life curve illustrates the relationship between DOD and cycle life. For example, at 100% DOD, a battery may last 300 cycles, but at 70% DOD, it may last over 800 cycles.
Energy/Watt-Hours of a LiPo Battery
The energy capacity of a LiPo battery is measured in watt-hours (Wh), calculated as: Energy (Wh)=Voltage (V)×Capacity (Ah)
Energy Density of a LiPo Battery
Energy density, measured in watt-hours per kilogram (Wh/kg), reflects how much energy a battery can store relative to its weight. Higher energy density is advantageous for weight-sensitive applications like drones.
Internal Resistance of a LiPo Battery
The resistance within the battery, generally different for charging and discharging, also dependent on the battery state of charge. As internal resistance increases, the battery efficiency decreases and thermal stability is reduced as more of the charging energy is converted into heat.
By mastering these specifications, users can select, operate, and maintain LiPo batteries for optimal performance and longevity. Always follow manufacturer recommendations for safe handling and usage. As a global leading lipo battery manufacturer, Grepow offers UAV batteries and semi-solid state batteries with an energy density of up to 320 Wh/kg, designed for superior performance across industrial and consumer applications. These batteries boast a cycle life exceeding 800 cycles, ensuring long-term reliability, and are available with options for high discharge rates and fast-charging capabilities to meet diverse operational needs. If you have any questions or needs, please feel free to contact us at info@grepow.com.
Related Articles
-

FPV Drone Types: All You Need to Know
2025-03-06 -

The Ultimate Guide to FPV Battey
2025-02-11 -

Exploring the Power Behind Quadrupedal Robots: A Deep Dive into Robot Dog Batteries
2025-01-22
Related products
-
Tattu 6S 32Ah 22.8V 10C HV Lipo Drone Battery
-
Tattu 3.0 18S Lipo 30Ah 68.4V Smart UAV Drone Battery
-
28000mAh 22.2V 6S Semi-Solid State Battery Pack

